Why Box Plots Should Be the Default Choice for Visualizing Performance Results
5 Reasons Why Box Plots are the Better Default Choice for Visualizing Performance 🔗

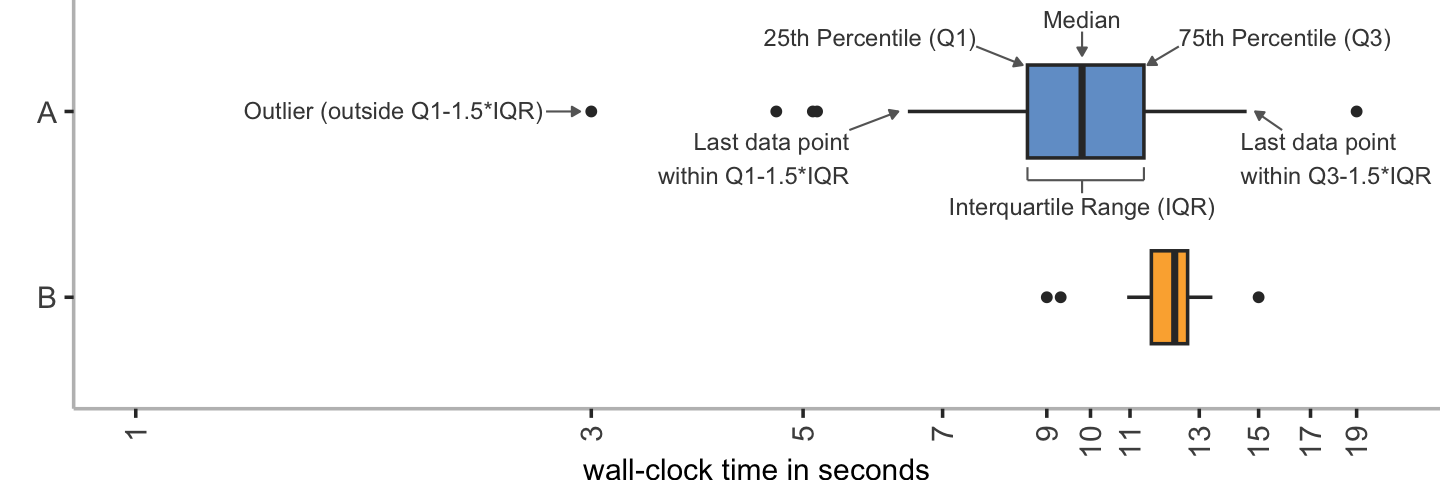
The text argues in favor of using box plots as the default choice for visualizing performance results over bar charts. It provides five main reasons to support this argument: 1) performance measurements are samples from a distribution, and box plots are designed to characterize distributions, 2) box plots allow detailed visual comparison of performance results, 3) they provide enough details compared to classic bar charts, 4) they don't overwhelm with details like other plot types such as violin plots, and 5) they are versatile and can be used for different types of experiments and distributions. The author concludes that box plots are a better default choice for communicating performance results in academic papers.
- Performance measurements are samples from a distribution
- Box plots allow detailed visual comparison
- Box plots provide enough details compared to classic bar charts
- Box plots don't overwhelm with details like other plot types
- Box plots are versatile and can be used for different types of experiments and distributions